Design Exploration
Design space exploration is one of the simplest applications of supercomputing. The idea is to study the impact of a parameter in the performance of a given design. By dividing the domain of the parameter among different computing threads, it becomes possible to do multiple performance evaluations at the same time, each using a different design generated from a different element of the parameter's domain.
To evaluate the benefits of the approach, we decided to experiment the design space exploration of a simple truss structure. We were interested in simulating the behavior of the structure as different parameters were changed. To have a metric for the structural performance, we focused on the maximum displacement of the structure's elements.
Khepri supports two different structural analysis backends, namely KhepriRobot that connects to Autodesk's Robot and KhepriFrame3DD, which directly accesses a DLL that wraps Frame3DD, static and dynamic structural analysis package for 2D and 3D frames, developed by Prof. Henri P. Gavin of the Department of Civil and Environmental Engineering of Duke University. Given that Robot does not work in non-Windows environments while Frame3DD does not require a graphical user interface, the choice for Khepri's backend KhepriFrame3DD was obvious.
Inspired by Gaudi's ideas, we decided to create a truss where each of the legs is defined by a catenary that connects the legs' endpoints. The legs are interconnected using different schemes, for example, just a single bar between corresponding pairs of nodes, or diagonal bars between pairs of pairs of nodes. To make the example more interesting, we decided to design a truss made of Bamboo, placed on a slab with a randomized outline, as follows:
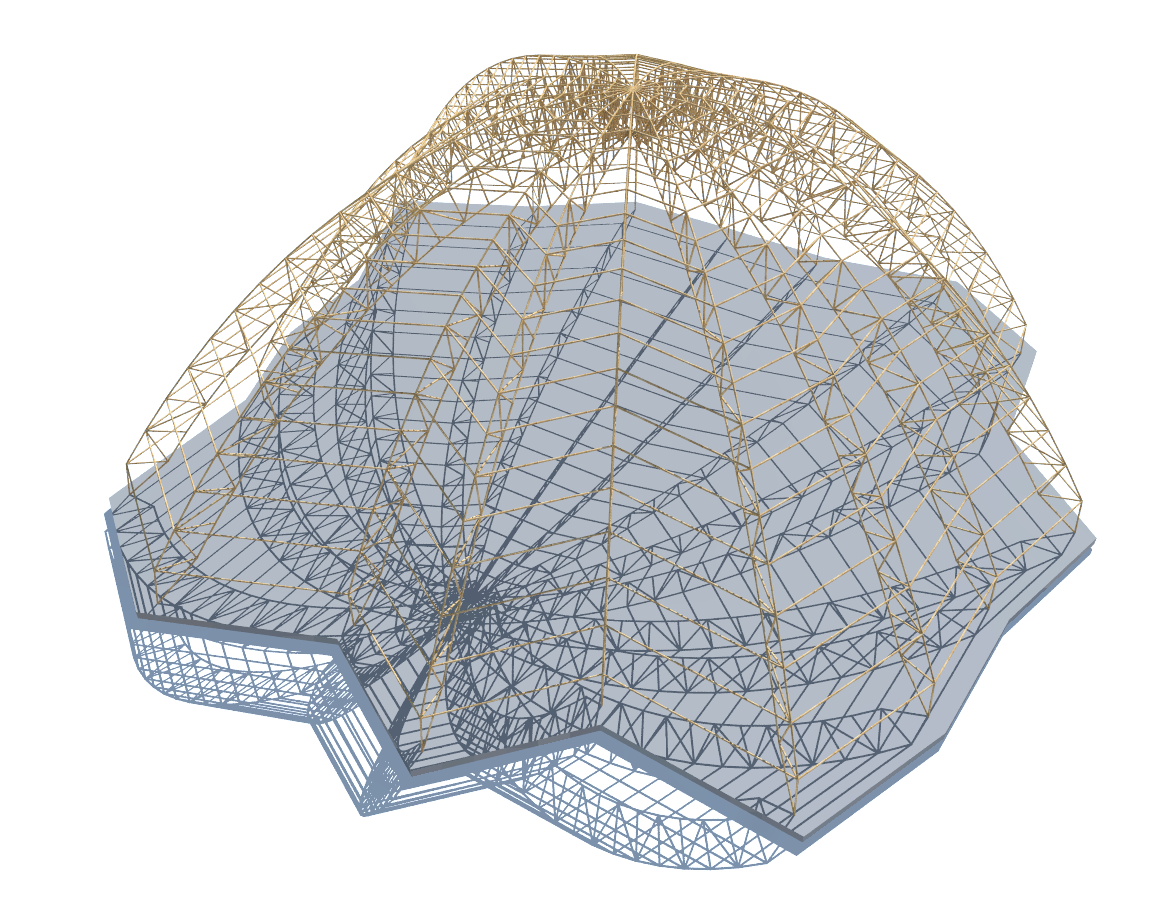
This means that the truss does not have an axis of symmetry and, therefore, will be less resistant. For the structural simulation we used an approximation of the material properties of Bamboo, namely, a Young's modulus of , a Kirchoff's modulus of , and a density of .
Our first experiment was to test a vertical load of increasing magnitude being applied to all non-supported truss nodes. The load started at zero and went up to 100 N. For each load case, the structure was analyzed by KhepriFrame3DD and the computed truss node displacements were used to show the shape of the truss under load. Note that these displacements tend to be miniscule when compared with the size of the structure. This means that its visualization tend to be difficult unless we amplify them. The following movie illustrates the truss behavior under increasing load but where we amplified the displacements by a factor of ten:
Nota that even with factor of scale of ten, the displacement seems still small, which makes comparisons difficult. To make the displacement more obvious, we then applied a factor of 100. This means that the actual truss deformation is one hundred times smaller than what is illustrated:
The entire analysis, containing 200 different load cases whose results were rendered in Full HD, required 1h46m to generate. One problem we had was that each structural analysis was entirely sequential and, thus, could not benefit from multiple CPUs or multiple computing nodes. On the other hand, it is relevant to mention that, for these examples, the largest fraction of the time is spent rendering, which is already highly parallelized and takes full advantage of the 96 CPUs available.
Another experiment was the addition of an horizontal force, which we established as one tenth of the vertical one. This small addition considerably impacts the structural behavior of the truss. The following movie compares the base load case, with this one.
The second analysis, again with 200 load cases, took 1h48m. Although we did the experiments one after the other, it would have been possible to run them in two different computing nodes, making the total time just the maximum of both times, i.e., 1h48m instead of their sum, i.e., 3h34m.
On a further experiment, we studied the impact of the truss bars' radius on the structural performance. The following movie illustrates the behavior of a truss that is loaded with a constant force of -10N on each truss node and where the radius of the truss bars goes from 3cm to 5mm. The entire analysis was completed in 1h03m.
To have a different perspective on the truss behavior, observe the following movie that more clearly shows the radius reduction and its effect on the structure shape under load.
The previous analysis required 1h04m to produce. Again, it would have been possible to explore multiple computing nodes, to execute multiple analysis at the same time. In fact, the limitation is not the computing power available but rather the human power available, as the motivation for further analyses only emerges after studying the results of the previous ones.
Finally, we decided to do a different design space exploration: this time, instead of exploring one design parameter, we explored different truss topologies. The difference lies in the bracings between nodes, as illustrated in the following image:
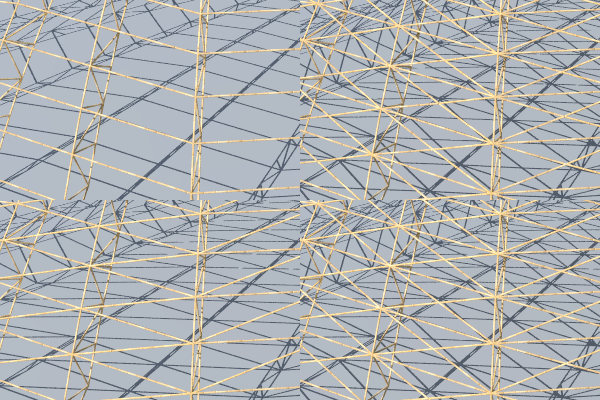
Although the two images on the right look very similar, they are different, as the one at the bottom has two independent bar connecting alternating nodes, while the top one has one extra node on the crossing between bars, effectively making them four independent bars connected at that extra node. This has a considerable effect on the truss' structural behavior as it hinders its resistance to compressive forces.
The behavior of the different truss topologies is illustrated in the following movie. All trusses were subjected to the same load case, an increasingly larger vertical force and an horizontal force that is one tenth of the vertical one. Remember that the displacement is amplified by a factor of 100.
Seen from the inside of the structure, the behavior seems a bit more impressive, as is visible in the following movie:
It is interesting to note that, with one exception, these different topologies take approximately the same time to evaluate, slightly under one hour. The exception is the structure at the top right corner, which has significantly more bars and nodes than the others, which causes KhepriFrame3DD to take an inordinate amount of time to analyze the structure (7h33m). Just in case, we repeated the four simulations twice but the results came almost exactly the same.
Given that the structural analysis is single threaded but chained with the rendering, which is multi-threaded, the best we can do is to analyze multiple cases in different computing nodes. The total time, though, is the maximum, that is, 7h33.